How to Boost Restaurant Profits Effectively by Upgrading Outdated KPIs
Running a profitable restaurant is more difficult today because costs are higher and sales come from many channels like dine-in, delivery, and online orders. Many restaurants still use old KPIs that show sales and costs but do not clearly explain where profit is made or lost. These outdated numbers can lead to poor decisions. This article explains why traditional KPIs no longer work and how using modern, easy-to-understand metrics can help restaurant owners improve profits, control costs, and make better daily decisions.
Why Traditional Restaurant Metrics Fail to Show True Profitability
Traditional restaurant metrics focus on volume and cost control, offering limited insight into how profit is actually created in today’s multi-channel restaurant environment. These measures often encourage short-term efficiency at the expense of long-term value. Refer to the table below for a clear comparison.
|
Traditional Metrics |
Why It Falls Short |
Impact on Profitability |
|
Table Turnover |
Focuses on speed rather than guest experience and upselling opportunities |
Faster turns may increase short-term revenue but reduce satisfaction and repeat visits; a 5% rise in retention can increase profits by 25 to 40% |
|
Labor Cost Percentage |
Encourages cost-cutting instead of productivity and service quality |
Understaffing leads to burnout and turnover; replacing an hourly employee costs $2,500 to $5,000, eroding savings |
|
Average Check Size |
Measures revenue, not profitability or customer value |
Higher checks driven by discounts or promotions can reduce margins if acquisition costs rise |
|
Sales Volume |
Tracks how much is sold, not how profit is created |
Ignores customer lifetime value, menu-level margins, and channel profitability |
Modern KPIs That Directly Influence Revenue, Margins, and Growth
Modern restaurant KPIs focus on understanding how revenue is earned, not just how it is recorded. These metrics connect marketing, operations, labor, and menu strategy directly to financial outcomes.
-
Customer Acquisition Cost (CAC): Measures how much is spent to acquire one new guest, including digital ads, discounts, and promotions. Industry benchmarks suggest that sustainable models maintain a Lifetime Value–to–CAC ratio of at least 3:1. If a customer generates $110 in lifetime revenue, acquisition costs should ideally remain under $35.
-
Customer Lifetime Value (LTV): Estimates total revenue from a guest over time based on visit frequency, average spend, and retention. Restaurants with loyalty programs typically see members spend 20 to 40% more annually than non-members. Tracking LTV allows operators to justify investments in CRM tools, personalization, and retention campaigns.
-
Revenue Per Labor Hour: Replaces static labor percentages with a productivity-focused view. For example, if a restaurant generates $15 per labor hour during peak periods but only $9 during off-peak times, scheduling can be adjusted to protect margins without hurting service.
-
Menu Contribution Margin: Evaluates profit at the item level rather than relying solely on overall food cost percentages. Many restaurants discover that 20% of menu items generate over 60% of total profit, while low-margin items quietly dilute earnings.
-
Digital Conversion Rate: Measures the percentage of website or app visitors who place an order. Industry averages range from 5 to 8%, while high-performing platforms exceed 12 to 15%. Small improvements in conversion often produce significant revenue gains without additional marketing spend.
Check out commercial kitchen inspections: a quick way to secure compliance and success to ensure compliance, safety, and smooth kitchen operations
How Smarter Metrics Improve Decision-Making Across Restaurant Operations
Upgraded KPIs transform operational data into clear, actionable insights across key restaurant functions, including marketing, labor planning, menu strategy, and digital channels. Instead of relying on isolated metrics, modern performance measurement enables faster decisions that directly improve margins and long-term profitability.
Using marketing data to attract profitable customers
Linking customer acquisition cost with customer lifetime value shifts marketing from traffic volume to revenue quality. This clarity helps operators identify high-performing channels, cut low-return spend, and reinvest in loyalty-led growth. Restaurants using this approach often reduce marketing inefficiencies by 15 to 25% within six months.
Aligning staffing decisions with real demand patterns
Revenue per labor hour enables staffing decisions based on demand trends rather than fixed schedules. Predictive scheduling using historical sales and traffic data typically reduces labor costs by 4 to 7% while maintaining service levels. Engagement and attendance tracking further protects margins by lowering turnover and absenteeism.
Improving menu profitability through data-led design
Contribution margin analysis informs smarter pricing, portion control, and menu layout decisions. Highlighting high-margin items and refining underperforming dishes increases profitability without raising prices. Many restaurants achieve an 8 to 15% increase in profit per guest through menu optimization alone.
Strengthening digital performance across ordering channels
Tracking conversion rates, abandonment, and channel profitability exposes friction in online ordering. Simplifying checkout, reducing menu complexity, and adjusting delivery pricing improve digital margins while reducing reliance on discounting.
The table below illustrates how decision-making changes when restaurants move from legacy KPIs to modern metrics:
|
Legacy KPI |
Modern KPI |
Better Business Insight |
|
Table turnover |
Digital conversion & retention rate |
Measures quality of demand, not just speed |
|
Labor cost % |
Revenue per labor hour |
Links staffing to sales productivity |
|
Average check size |
LTV and CAC |
Evaluates true customer profitability |
|
Food cost % |
Menu contribution margin |
Identifies profit-driving menu items |
|
Total sales |
Channel-level margin |
Reveals which sales are actually profitable |
This shift enables managers to act proactively rather than reactively, addressing margin leaks before they impact monthly results.
Explore mastering inventory management: tips every commercial kitchen technician must know to cut waste, control costs, and keep your kitchen running efficiently
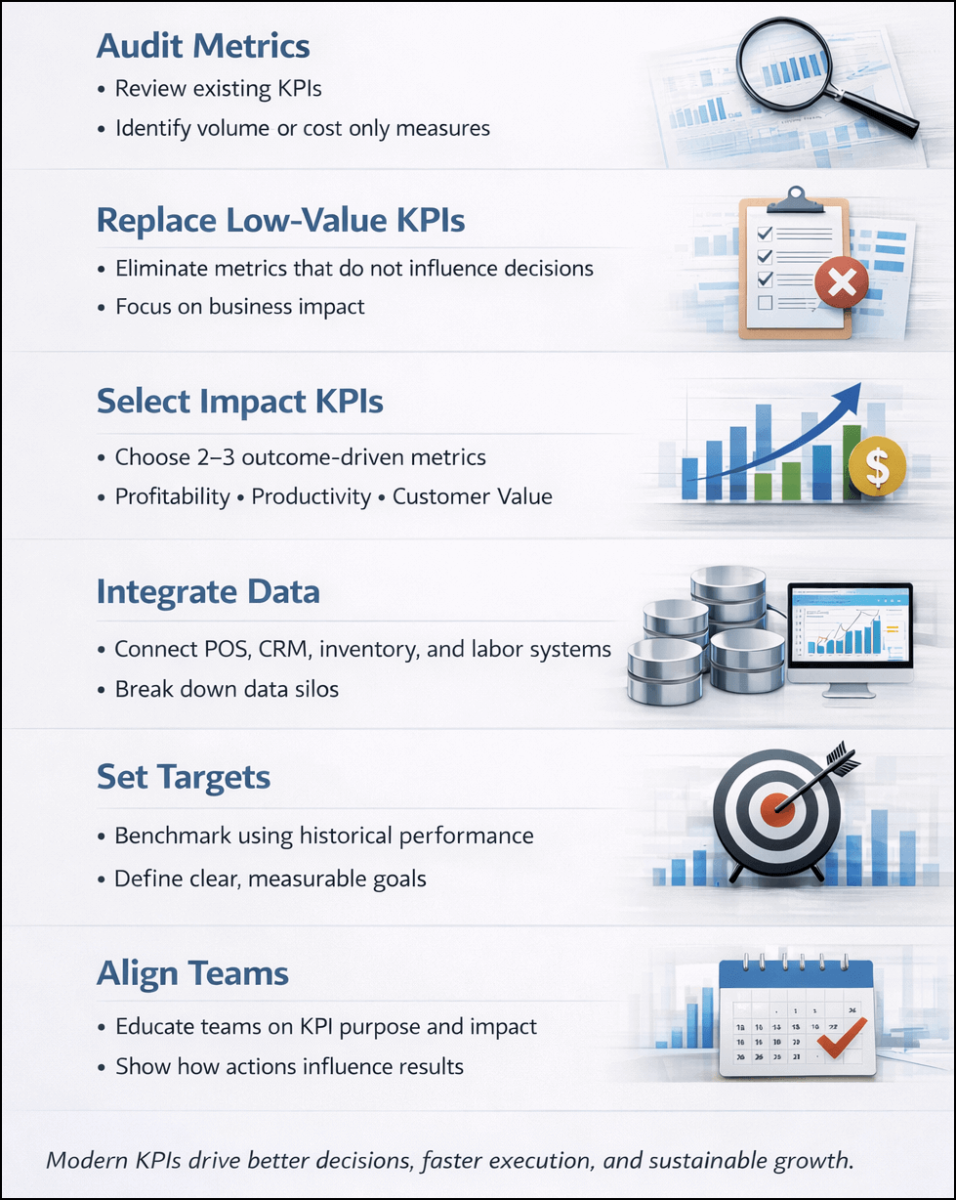
A Step-by-Step Framework for Replacing Legacy Measures with Modern Metrics
Modernizing KPIs does not require a full overhaul overnight. A structured, step-by-step approach helps organizations transition from volume-based metrics to measures that drive profitability, productivity, and customer value. Refer to the infographic below for a clear, visual breakdown of how to audit existing KPIs, introduce high-impact replacements, align teams, and operationalize modern metrics effectively.
Summary: Profitable Restaurants Measure Value, Not Just Volume
Restaurant profitability today depends on measuring value rather than volume. Outdated KPIs no longer reflect how revenue is generated across dine-in and digital channels. By adopting modern metrics such as customer lifetime value, revenue per labor hour, menu contribution margin, and digital conversion rates, restaurants gain clearer insight into profitability drivers. This shift enables better decisions, stronger margins, and sustainable growth in an increasingly complex operating environment.
Key Takeaways
-
Traditional restaurant KPIs focus on volume and cost control but fail to explain true profitability in a multi-channel environment.
-
Modern KPIs such as Customer Lifetime Value, Customer Acquisition Cost, and Revenue per Labor Hour directly link operations to profit.
-
Measuring productivity instead of percentages improves staffing efficiency while protecting service quality.
-
Menu contribution margin analysis reveals which items truly drive profit, not just sales volume.
-
Digital performance metrics uncover hidden revenue opportunities without increasing marketing spend.
-
A phased KPI upgrade enables smarter, faster decisions without disrupting daily operations.
Order commercial kitchen replacement parts at PartsFe UK, the trusted supplier of high-performance catering spares. We offer parts for dishwashers, fryers, ice machines, ovens, griddles & grills, along with essential plumbing, electrical, hardware, and janitorial supplies. PartsFe UK stocks reliable components for leading brands, including Bakers Pride, Blodgett, Frymaster, and Garland, ensuring your professional kitchen stays up and running at peak performance.
References:
https://www.gov.uk/service-manual/measuring-success/how-to-set-performance-metrics-for-your-service?utm_source=chatgpt.com
https://www.london.gov.uk/sites/default/files/final_london_food_strategy.pdf
FAQs
How often should restaurants review their KPIs?
Core operational KPIs should be reviewed daily or weekly, while strategic metrics like profitability trends and customer lifetime value should be reviewed monthly or quarterly.
What is a healthy profit margin for a restaurant?
Most restaurants operate with net profit margins between 3% and 5%, though well-optimized operations can achieve higher margins.
Can KPIs help reduce staff turnover?
Yes. Productivity-based KPIs help improve scheduling, workload balance, and performance recognition, which reduces burnout and turnover.
Are KPIs useful for small or single-location restaurants?
Absolutely. Even small restaurants benefit from tracking a few high-impact KPIs to improve cost control, staffing efficiency, and decision-making.
Do restaurants need expensive software to track KPIs?
No. Many KPIs can be tracked using POS reports and basic management tools, with advanced software added as the business grows.